The Metrics view of your Ubicloud PostgreSQL instance provides various signals
for monitoring the performance and health of your PostgreSQL instances.The time-range dropdown allows you to choose a time-frame for the graphs,
ranging from 30 minutes to 30 days. Each graph displays about 480 datapoints.
The graphs auto-update every 5 minutes. You can also manually update the graphs
with the refresh button.If you recently provisioned the PostgreSQL database, it might take a few minutes
for the metrics to become available. For databases with HA enabled, the metrics
from the primary node are displayed.Here are some of the key metrics provided and details on how to interpret them.
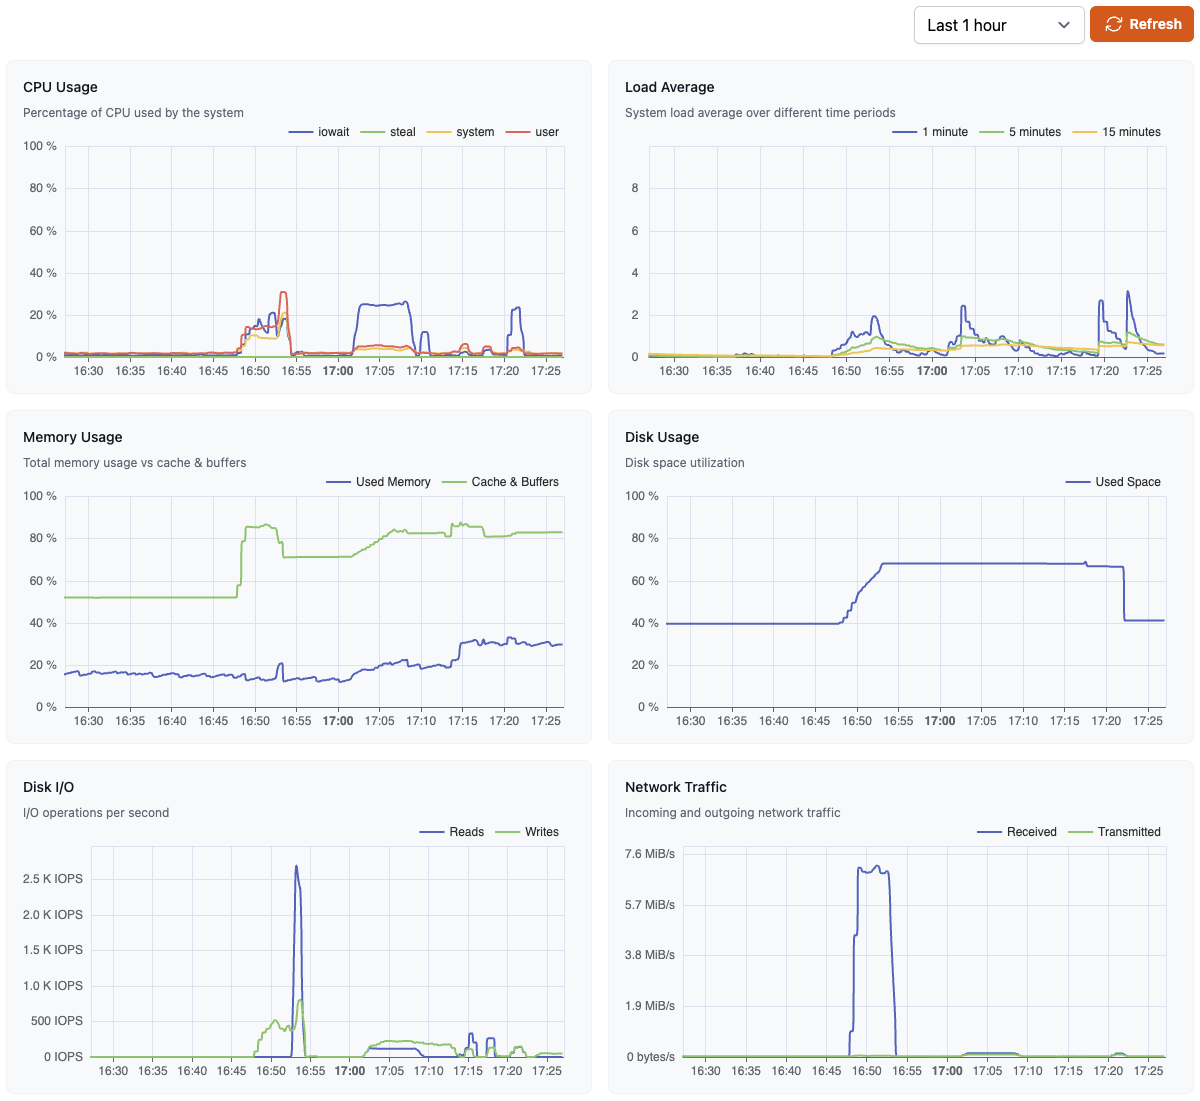
This shows the CPU usage, broken down into percentage of CPU time
spent in user, system, iowait, softirq and steal modes. The user time
reflects processing in the Postgres instance, while the system time reflects
operating system (i.e., kernel) operations.
Load Average shows average CPU usage over the last 1, 5, and 15 minutes.
Typically, a load average equal to the number of CPU cores indicates full
utilization of all CPUs. A load average higher than the number of CPU cores
indicates that the system is overloaded, and processes are waiting for CPU time.If you are consistently seeing high load averages, you might want to consider
upgrading to a larger database size.
This shows the memory usage, broken down into Used, Cached & Buffered memory. A
high amount of memory usage for Cache & Buffers is normal and indicates that the
database is using the available memory efficiently. A consistently high (> 90%)
value for Used memory indicates that the database might be running low on
available memory, which can lead to performance issues.
Disk Usage is the disk space utilization for the database, specifically the
Postgres data_directory. This includes the database contents, log files, and
WAL files, among other things. If your instance is approaching 100% disk usage,
you might want to consider upgrading to a larger database size.
This metric shows the disk read and write operations per second for the database
instance. High values for this metric can indicate that the database is
experiencing high I/O load, which can lead to performance issues.
This metric shows the incoming and outgoing network traffic for the database
instance. Generally, this should match the behavior of other metrics for the
instance. Unusual activity in this metric might indicate a problem with the
network or the database instance itself.
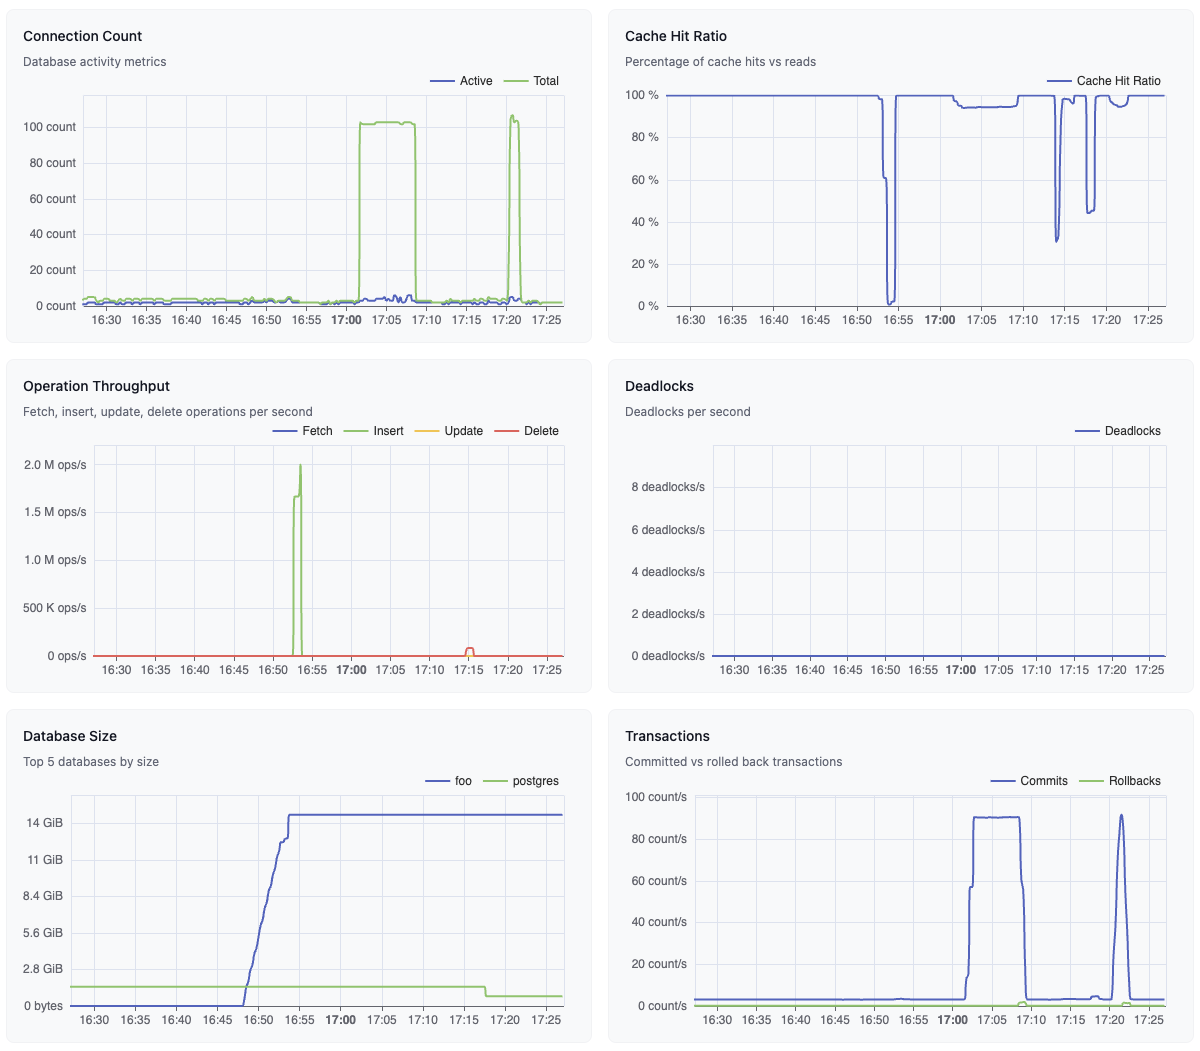
This shows the Active and Total number of connected Postgres clients. Total
connection count refers to all currently connected clients, while Active
connection count refers to clients that are currently executing a query. By
default, the maximum number of connections is set to 500. If your database is
consistently at or near this limit, you might want to consider increasing this
limit or using connection pooling via PgBouncer.
This metric indicates how many content requests were served from the cache. For
normal workloads, this should typically be above 99%. If this value is low, it
might indicate that the database performance might improve with a larger
instance with more memory.
This graph shows the rate of row fetches, inserts, updates, and deletes per
second. This can be useful for identifying unexpected changes in usage patterns
and their effects on database performance.
This metric shows the rate of deadlocks detected per second in the database.
Deadlocks occur when two or more transactions are waiting on resources held by
others, resulting in a situation where none of them can proceed. A non-zero or
high value indicates bad transaction design, which can lead to degraded
performance.
This graph shows the size of the 5 largest databases in the instance. This can
be useful in identifying databases that are growing unexpectedly or are due for
cleanup or archiving.
This graph shows the rate of transactions committed and rolled back per second.
This can be useful for identifying unexpected changes in usage patterns and
their effects on database performance.
It is possible to send various metrics such as CPU usage, disk IO, database
locks from your database to external targets. Metrics destinations use
Prometheus’ remote-write protocol to send metrics. Any destination that supports
remote-write protocol, can be used as a destination of Ubicloud PostgreSQL
metrics. You can find destinations that support remote-write protocol
here.
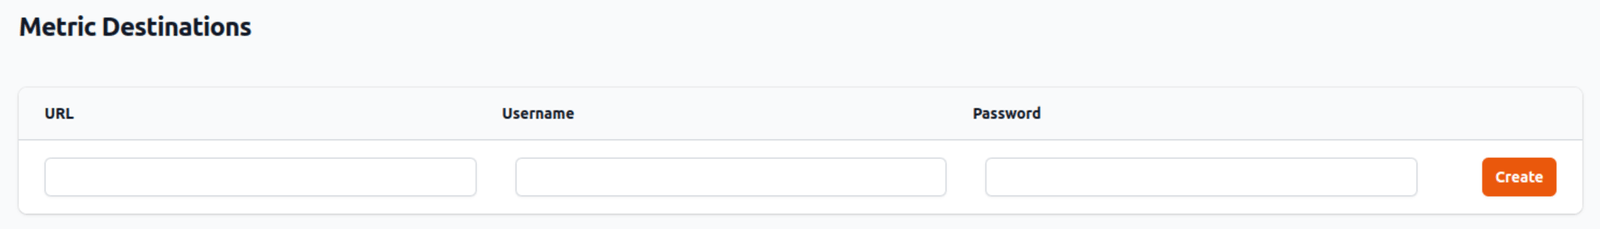
Setting up a metric destination is easy. Just open the PostgreSQL server details
page. You can enter connection details of the remote destination in the “Metric
Destinations” section.We need 3 pieces of information; URL for sending metrics to, and also
username/password for authentication. We only accept https:// endpoints. In this
way we ensure that the data we are sending is encrypted at transit.
Metrics from the database itself: Database metrics are collected by
postgres_exporter.
It contains information about database size, active connections, write/read
activity, replication, WAL archival, autovacuum and many more.
Metrics from the underlying virtual machine: Virtual machine metrics are
collected by node_exporter. It
contains information about CPU usage, disk IO, filesystem usage, memory
consumption and network transfe